Massage Therapist Salary in Illinois: $64,537 (2026)
Quick Answer:Across Illinois's 64 metropolitan areas, the average median massage therapist pay sits at $64,537/year heading into 2026 — a figure projected from 2025 BLS OEWS wage data for SOC 31-9011. Because Illinois sits at BEA RPP 97.1 (3% below the U.S. baseline), that statewide median translates to roughly $66,464 in nationally-comparable purchasing power. Highest-paying metros: Moline ($63,506), Rock Island ($62,522), Decatur ($61,877).
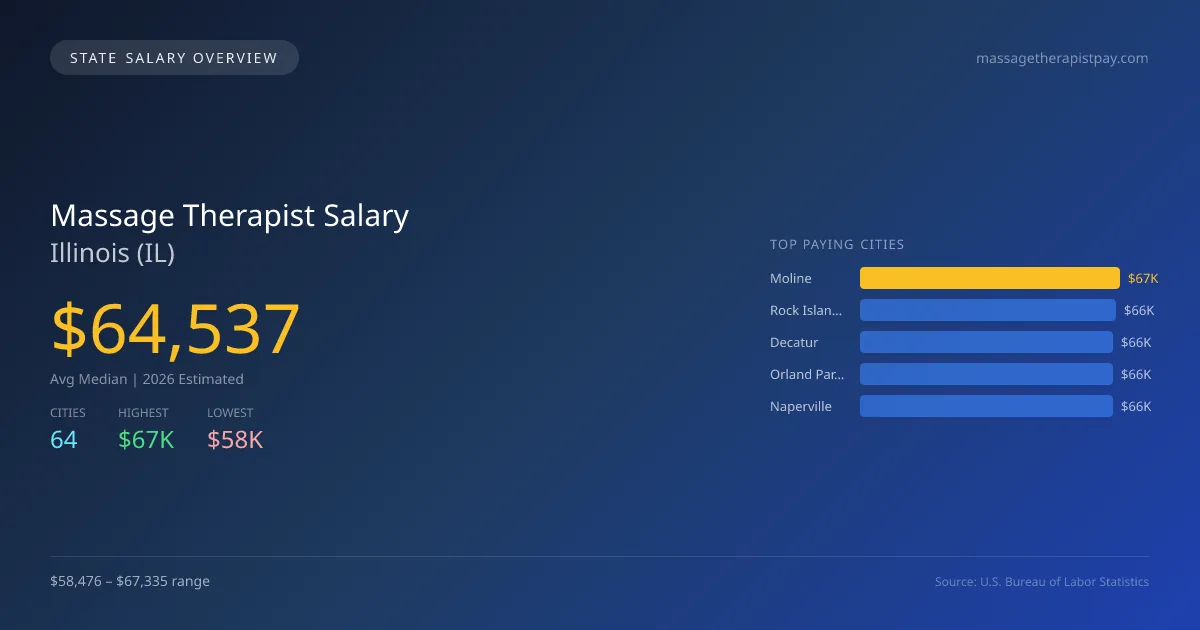
In 2026, the average median salary for massage therapists in Illinois is projected to be $64,536, which is 4.1% higher than the national median of $61,975. The highest-paying city for this profession is Moline, with a salary of $67,335, while Bloomington offers the lowest at $58,476. This salary gap of $8,859 can be attributed to various factors, including demand in urban centers, cost of living, and local economic conditions. Illinois has specific state licensing requirements, including completing a state-approved education program and passing exams. These regulations ensure a standard of practice and can impact salary levels. Additionally, region-specific demand drivers, such as population density and health trends, contribute to variations in compensation across cities. The job market for massage therapists in Illinois shows a promising outlook with an annual growth rate of 6.03%. There are currently 5,124 massage therapists employed across the state, indicating a steady demand for services. Areas like Rock Island, Decatur, Orland Park, and Naperville all see strong projected salaries ranging from $65,568 to $66,292, reflecting the overall healthy market conditions in Illinois for massage therapy professionals.
Illinois Massage Therapist Salary Range
Overall salary range in Illinois: $33,081 (lowest entry-level) to $104,370 (highest top earner)
Illinois vs National Average
Illinois massage therapists earn 4.13% more than the national median (+$2,562/year difference).
Illinois Massage Therapist Salary Distribution (2026)
Massage Therapist salaries in Illinois range from $36,226 (entry-level, 10th percentile) to $88,878 (top earners, 90th percentile), with a median of $64,537. The Illinois median is $2,562 above the US national median of $61,975. The average hourly rate is $31.02/hr. Approximately 5,124 massage therapists are employed across 64 cities.
2019 BLS Actual
$47,943
2025 BLS Actual
$60,866
2026 Current Est.
$64,537
2019–2027 Growth
+42.7%
Salary Trajectory for Massage Therapists in Illinois (2019–2027)
2019–2025: actual BLS OEWS data for this metro area. 2026+: CAGR 6.03% projection.
| Year | Annual Salary | Status |
|---|---|---|
| 2019 | $47,943 | Actual |
| 2020 | $50,620 | Actual |
| 2021 | $49,052 | Actual |
| 2022 | $60,642 | Actual |
| 2023 | $62,801 | Actual |
| 2024 | $59,433 | Actual |
| 2025 | $60,866 | Actual |
| 2026(current) | $64,537 | Estimated |
| 2027 | $68,428 | Projected |
Based on 7 years of BLS OEWS data for the Illinois metropolitan area, the median massage therapist salary grew 27.0% from $47,943 (2019) to $60,866 (2025). At a 6.03% compound annual growth rate, salaries are projected to reach $68,428 by 2027 — a total increase of $20,485 (42.73%) from 2019.
Note: Historical values (2019–2025) are actual BLS OEWS figures for the Illinois metropolitan area, sourced from annual Occupational Employment and Wage Statistics surveys. 2026–2026 figures are current estimates, and 2027 values are projections, calculated using a 6.03% CAGR derived from 7-year BLS historical data. Actual salaries may vary based on employer, experience, certifications, and local market conditions.
Top 5 Highest Paying Cities in Illinois
Lowest Paying Cities in Illinois
| City | Median Salary |
|---|---|
| Bloomington | $58,476 |
| Peoria | $59,663 |
| Carbondale | $60,606 |
| Elmhurst | $61,210 |
| Calumet City | $61,361 |
Best Value Cities for Massage Therapists in Illinois
When adjusted for local cost of living, these Illinois cities offer the most purchasing power for massage therapists.
| City | Nominal Salary | CoL Index | Adjusted Salary |
|---|---|---|---|
| Springfield | $64,975 | 92.745 | $70,058 |
| Rockford | $64,551 | 92.154 | $70,047 |
| Champaign | $64,859 | 92.704 | $69,964 |
| Moline | $67,335 | 97.1 | $69,346 |
| Rock Island | $66,292 | 97.1 | $68,272 |
Adjusted salary = nominal salary × (100 / CoL index). CoL index: 100 = national average. Lower index = lower cost of living.
Salary by Experience Level in Illinois
| Experience Level | Estimated Annual |
|---|---|
| Entry Level (0-2 years) | $36,226 |
| Mid Career (3-7 years) | $64,537 |
| Experienced (7+ years) | $88,878 |
Estimates based on BLS percentile data averaged across Illinois metro areas. Individual pay varies by employer, certifications, and specialization.
All 64 Cities in Illinois
More Illinois Salary Data
Senior / Experienced
Top earner salaries for experienced massage therapists.
Compare Cities in Illinois
View all comparisons →Explore More Massage Therapist Salary Data
Frequently Asked Questions
How much do massage therapists make in Illinois in 2026?
What is the highest paying city for massage therapists in Illinois?
How does Illinois massage therapist pay compare to the national average?
What is the entry-level massage therapist salary in Illinois?
How many massage therapists are employed in Illinois?
Which Illinois city offers the best value for massage therapists?
Written by Jordan Lee, LMT
Career Analyst
Jordan Lee has 10 years of experience in massage therapy. They specialize in sports massage. They work in a wellness center.
Methodology & Data Source
Statewide salary figures on this page are 2026 projections based on the Bureau of Labor Statistics Occupational Employment and Wage Statistics (OEWS) survey, May 2026 release. A 6.03% compound annual growth rate (CAGR), derived from 6-year national BLS wage trends, was applied to each metro area's reported salary to estimate current 2026 massage therapist compensation across Illinois. State averages are employment-weighted across 64 metro areas — larger metro areas with more massage therapistscontribute proportionally more to the average, producing figures that better reflect typical compensation. Individual pay varies by city, employer, certifications, and experience.
Data Sources & Methodology
Source: BLS, OEWS, 7-year dataset (–). Per-city data from annual BLS metropolitan area surveys.
2026 figures are projected from 2025 BLS data using a compound annual growth rate (CAGR) of 6.03%, derived from historical BLS wage trends for massage therapists (SOC 31-9011).
Compiled and verified by Jordan Lee, LMT, a licensed massage therapist with 10+ years of clinical experience. · View source data at BLS.gov